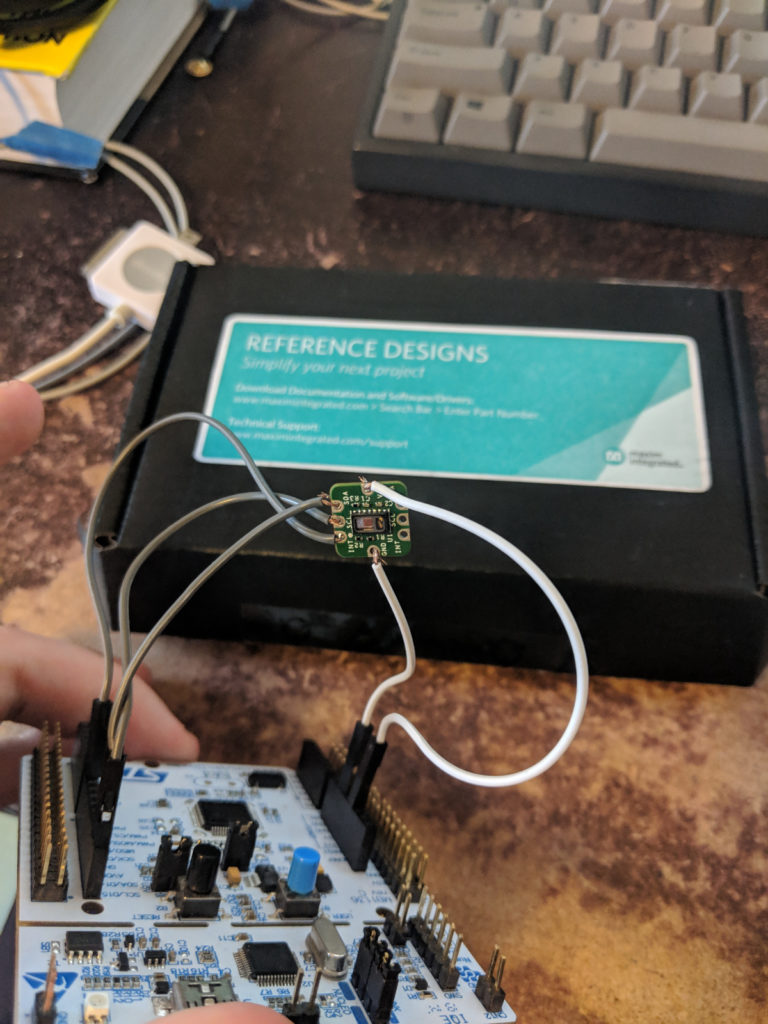
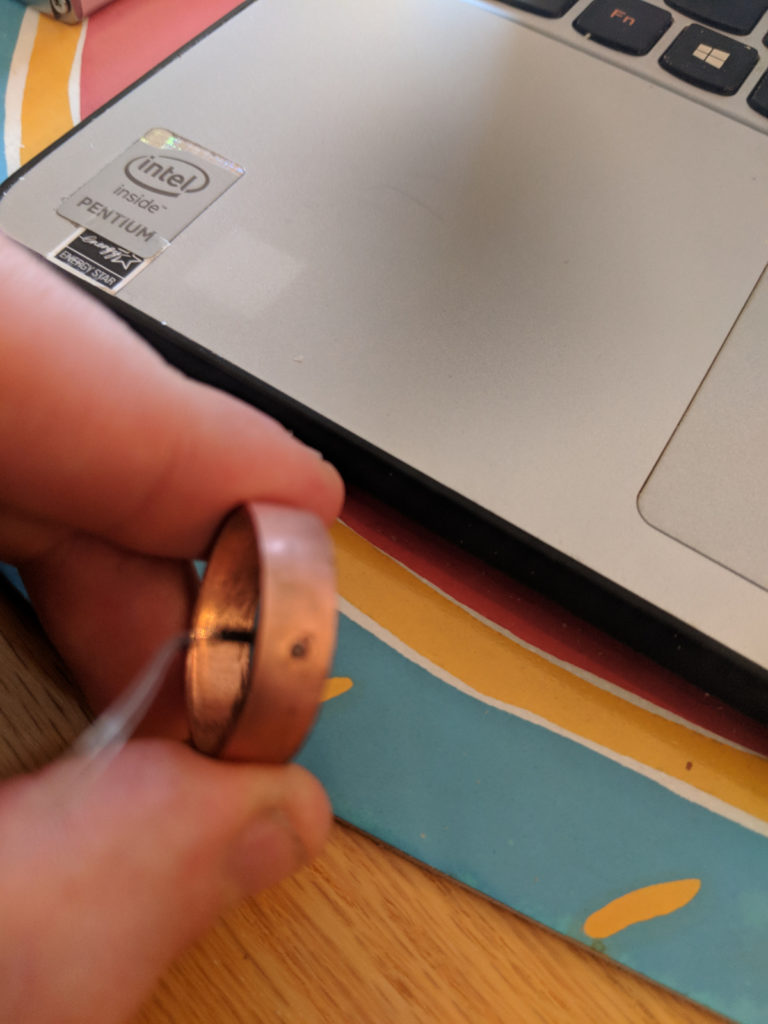
The MAX30102 arrived and I spent some time. I’ve also gotten metal disks and will try to make rings with polymer clay to hold the electrodes for GSR on better. As such I’m busy and this will be brief.
The device itself is tiny.
After reading through the datasheets, I wrote something to set registers for SpO2 measurements (IR and red LEDs active, there’s a heart rate mode with only one), and after having bad luck with guessing appropriate settings, eventually found all the recommended settings in the application notes for the demonstration board.
I had a bit of difficulty getting data from it, if just because it’s smart. There’s a 32 sample FIFO circular buffer for the data, which is accessed by repeated reading a single byte register. The read and write pointers are accessible but unnessesary for this, as they both automatically increment. Samples are 2 24 bit numbers (IR and red channel). As is, the program I’m using to read data sets an interrupt enable flag on the MAX30102 to check it for available data and then checks it repeatedly. There is also an almost full interrupt, and I spent some time getting the MAX30102 to trigger the nucleo, but I’m still having trouble reading multiple samples from the ADC.
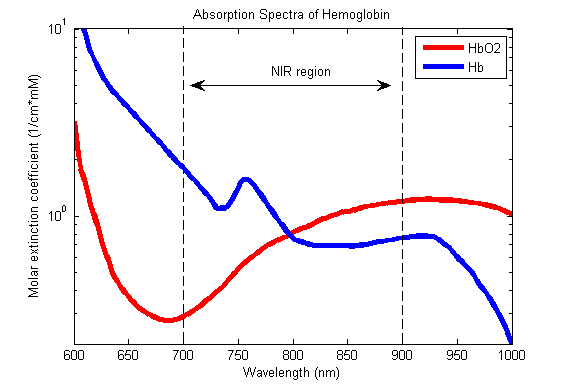
In which I trudge through some simple tests and realize it helps to read a bit before starting things. Today I tried to make a very very simple photoplethysmogram (light-enlargment-gram). Flesh is relatively transparent to red and infrared light, and that changes with the amounts of blood in one’s tissue. This can be used to measure heart rate. The light absorption of hemoglobin changes depending on whether it is attached to oxygen or not. This can be used to measure heart rate too, as well as oxygen saturation (pulse oximetry).
A nice combination of sensors for a wearable watch+ring would be PPG, perifereal temperature and galvinic skin response. I spent a couple of hours trying to get a basic PPG with some IR LEDs and photodiodes. Unfortunately I charged ahead without reading anything and now realize that PPGs are done differently from what I had assumed. Basically, I was just trying to measure IR light reflected (diffusely) by tissue over time.
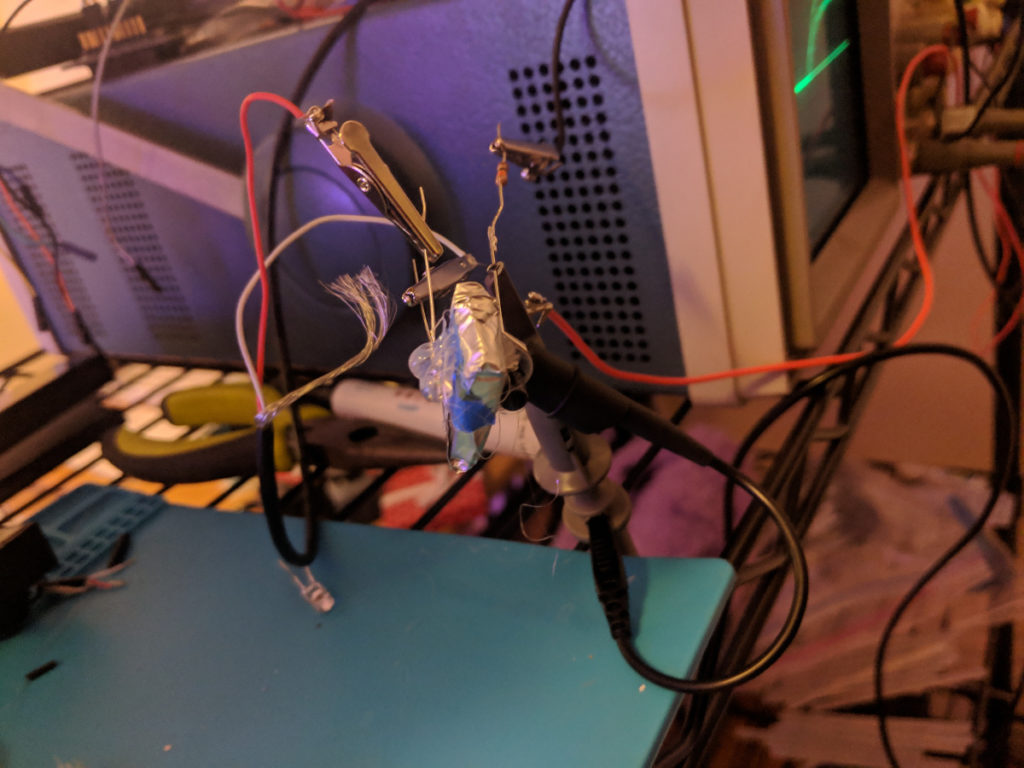
I bought some 940 nm IR LEDs and photodiodes and made a photointerrupter as a test (read: pointed them at each other and looked at voltages as I put my hand between them). I also played with them as a distance sensor by reflecting the IR off of objects. This was neat.
IR led (which has a neat blue glow on camera) and photodiode, with voltage measured by the oscilloscope. I tried multiple distances and orientations.
Unfortunately there was no obvious change in reflected IR during a heartbeat when they were pointed into my wrist. I moved them much closer, which caused the diode to always be saturated. I then tried it with a shield around the IR led made of tin foil, securing them together with hot glue. The diode was always saturated in this case as well.
I then tried seperating them with a peice of cardboard. This worked and generated a very small signal fluctuating with my heart beat when it was pressed against flesh. I’m not confident that this was PPG as opposed to just changes in distance and pressure.
Oximetry is done with a pair of LEDs, a red (660 nm) and an IR one (940nm). Hemoglobin with oxygen absorbs more infrared (NOTE: the paper has an error here “more infrared light (660 nm wavelength) and lesser red light (940 nm wavelength) than Hb.” reverses the frequencies compared to the colors).
Stolen from http://www.dnatechindia.com/basic-working-pulse-oximeter-sensor.html
The ratio of the varying to constant intensities of each LED color is calculated, and the ratio of the two ratios is compared to an empirical fitting to give the saturated O2 levels. Measuring this accurately by reflection is hard, the paper reads as a failure (“presents challenges”), but heart rate is easier than oxygen saturation.
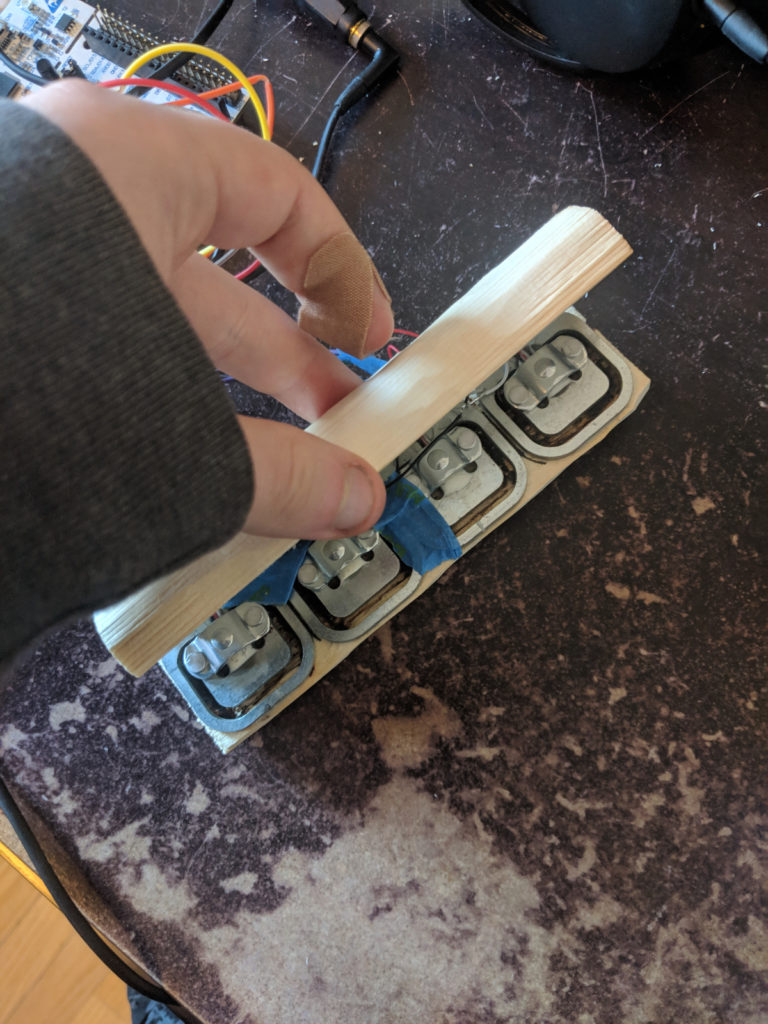
I carved handles out of wood and mounted the strain sensors in it.
Gripping it as hard as I can. Was interesting to see grip strength fail and then increase again when I redoubled my efforts.
Seems to be a working, if low quality dynamometer. If I was to redo this I would build more around the grip and possible use different strain sensors. I might measure the effects of irraditation (tensing other muscles in this context) on grip strength later.
Grip strength can be used as a measure of overtraining.
There are ADC + strain gauge meters on ebay for hobby bodyweight scales (HX711) that should be good for measuring up to around 200kgs. I ordered one and plan to put the gauges between a pair of half cylinders of wood to measure grip strength.
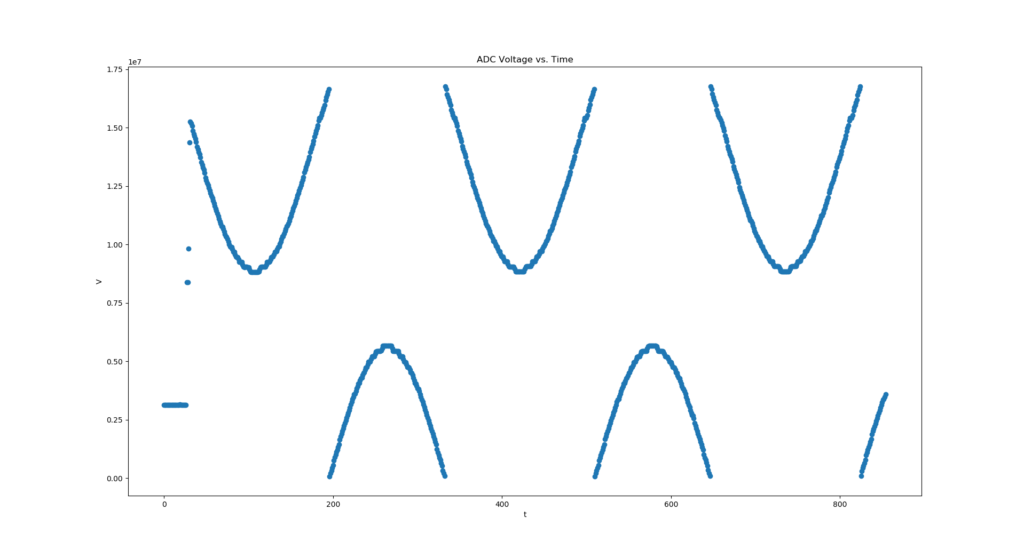
The HX711 can communicate with microcontrollers with a 2 wire interface like I2C. I’ve gotten this working with the Nucleo and tested it by having the Nucleo output a sin wave and reading the voltage that the HX711 measured.
project stuff here, remember that all the Nucleo stuff is compiled using the mbed compiler
Voltage measured by the HX711. Output is in two’s complement, which is why the sin wave is split between top and bottom. You can see the quantization in the DACs output because there’s a minimum 64 fold amplification for the HX711. This means that even a tiny voltage swing will saturate the output.
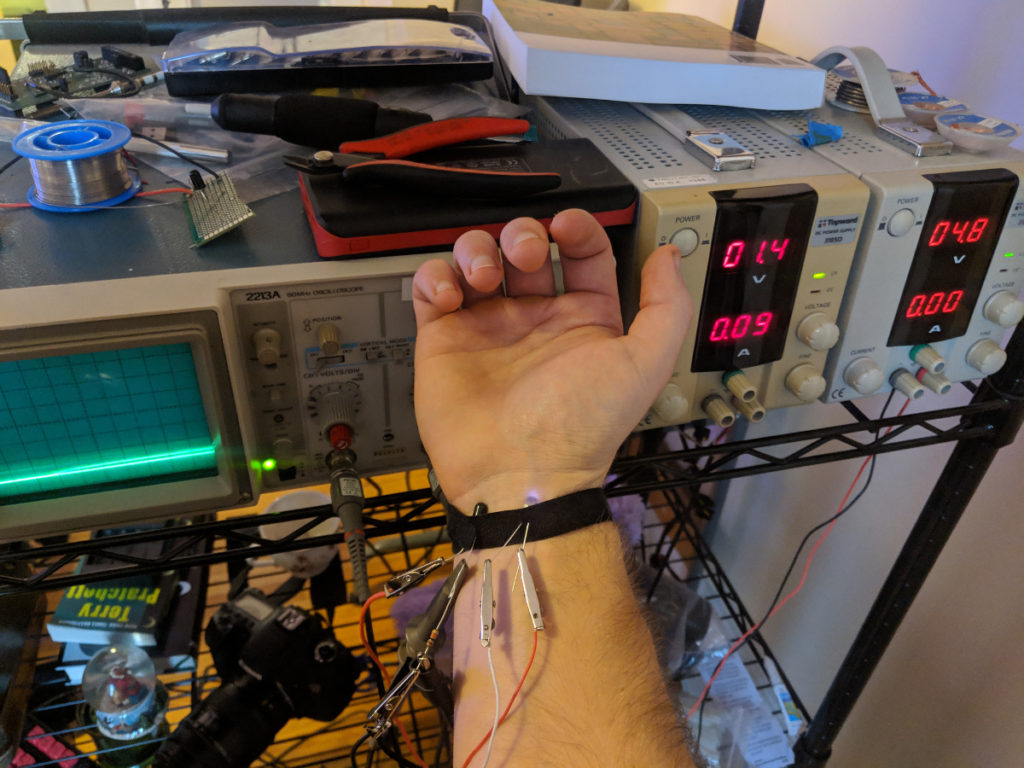
Two biofeedback sensors I can probably get working faster than the EEG are hand temperature and galvinic skin response. Hand temperature biofeedback is mostly used to train relaxation. Adrenaline restricts bloodflow to the skin and hands, so by training yourself to warm your hands you can learn to reduce adrenaline levels. Galvinic skin response is similar. People sweat more when nervous, filling sweat ducts with sweat. This is most pronounced on the hands and feet. Sweating reduces skin resistance by providing a conductive channel into the skin. This effect happens in seconds, and is used in polygraphs to detect lies.
For the most part, the resistance inside the body is low enough not to matter when measuring galvinic skin response. The simplest way to measure skin resistance is to put a current through two electrodes in contact with the skin and measure the voltage difference. This is usually done with electrodes on the index and ring fingers.
(For much more detail on measuring galvinic skin response, see Electrodermal Activity by Wolfram Boucsein)
While high temperature measurements usually use thermocouples, the easiest way to measure hand temperature is by using thermistors. The thermistors linked go between about 80k-100k Ohms around 70-100F. They are incredibly small, which gives them really fast response times and makes it easy to keep them around skin temperature.
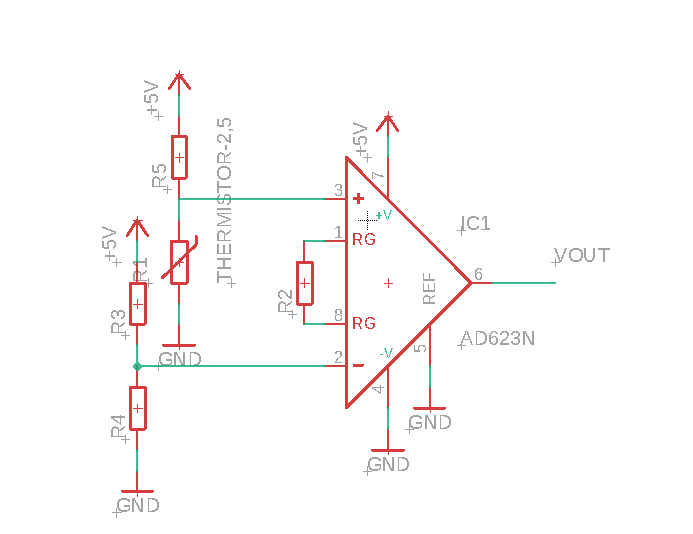
For measuring each of these resistances, I constructed voltage bridges with instrumentation amplifiers to increase the voltage range. I then used the integrated ADCs in the Nucleo microcontroller I have to measure the voltage.
Set up the voltage bridge with R3/R4 to be a bit below the lowest voltage between R1/R5. Select gain resistor so that Vout is below 3.3V when R1 at its highest. This setup can be used with both GSR and hand temp, but will require different resistors. GSR would probably benefit with variable resistors to set gain and comparison voltage.
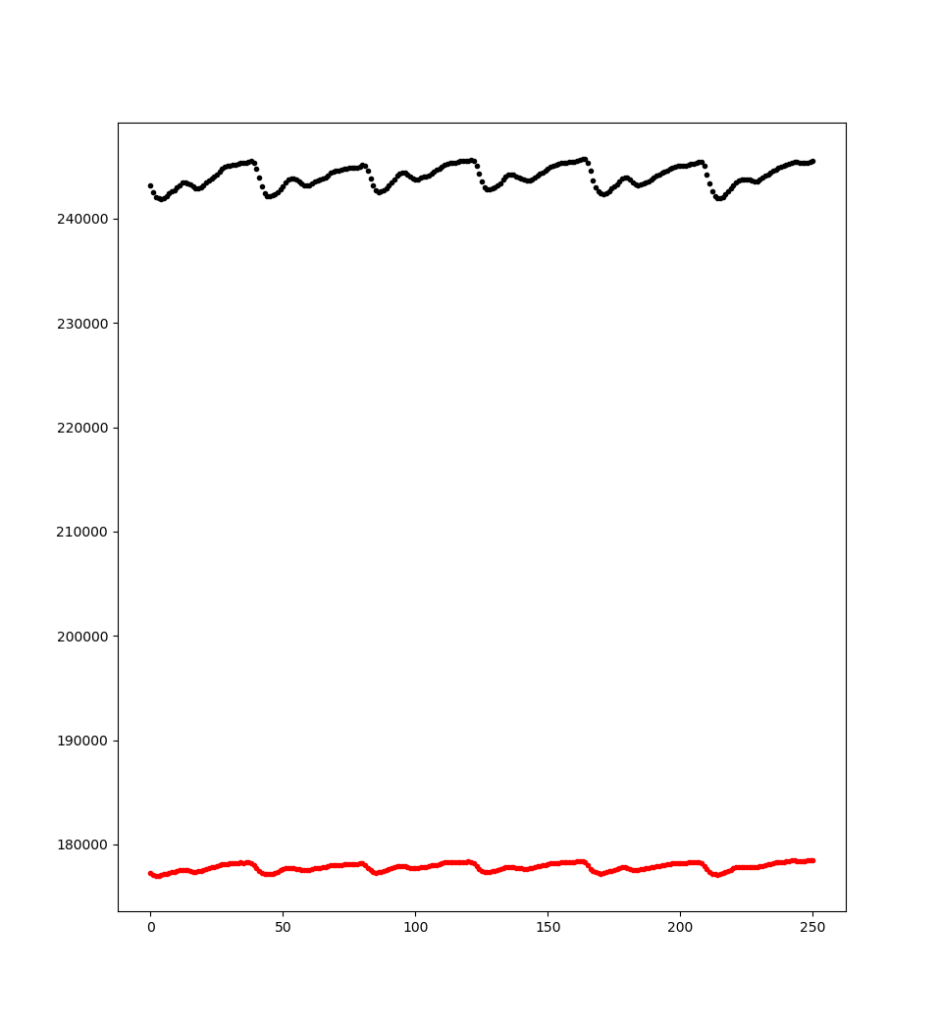
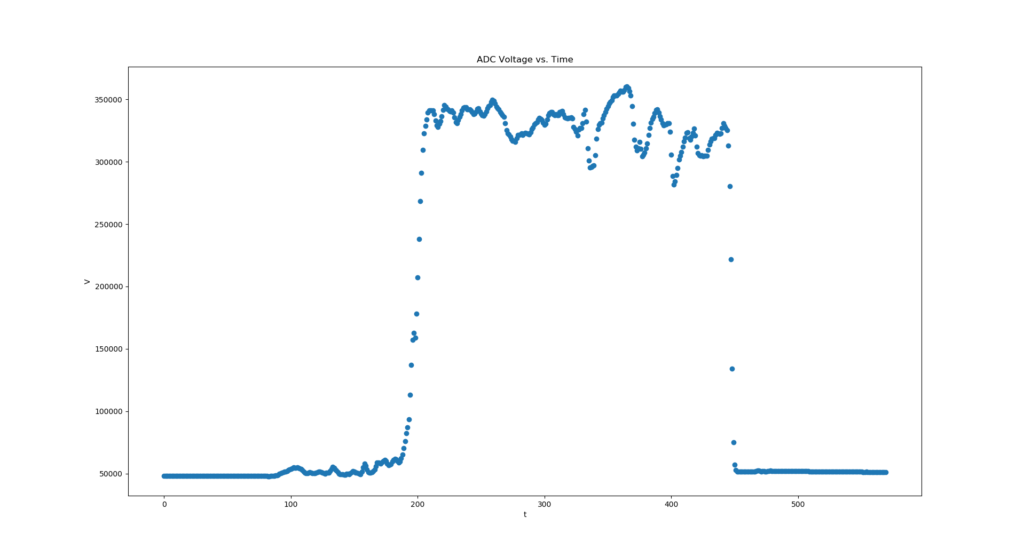
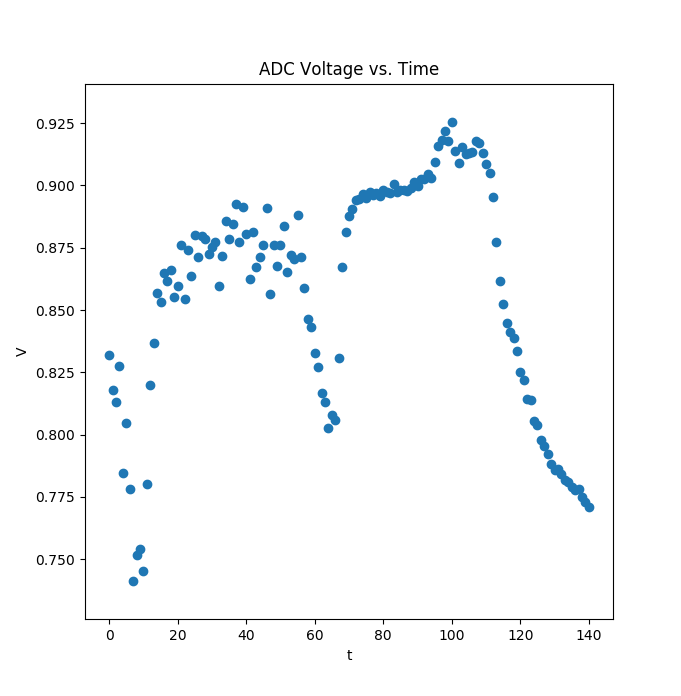
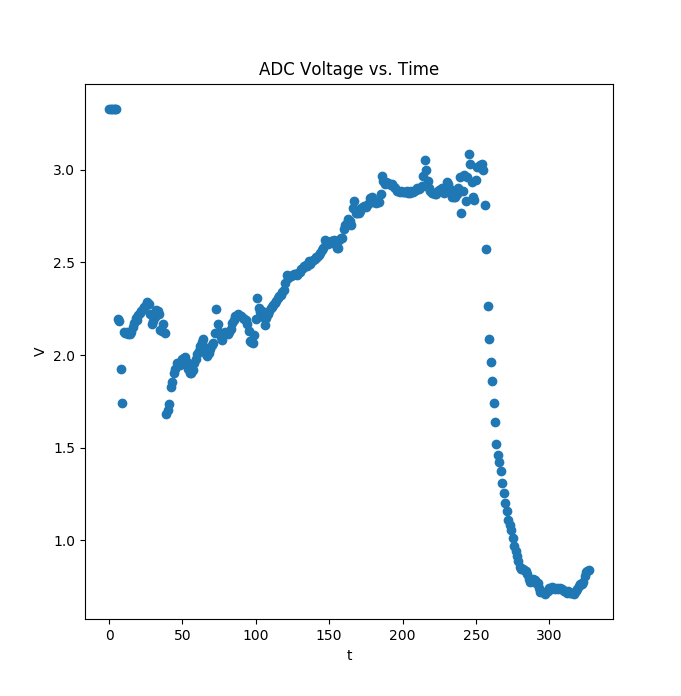
Plot of voltage measured for thermistor as I grabbed an icepack at t=50 and t=110.Voltage for skin resistance, again grabbing an icepack at T=220
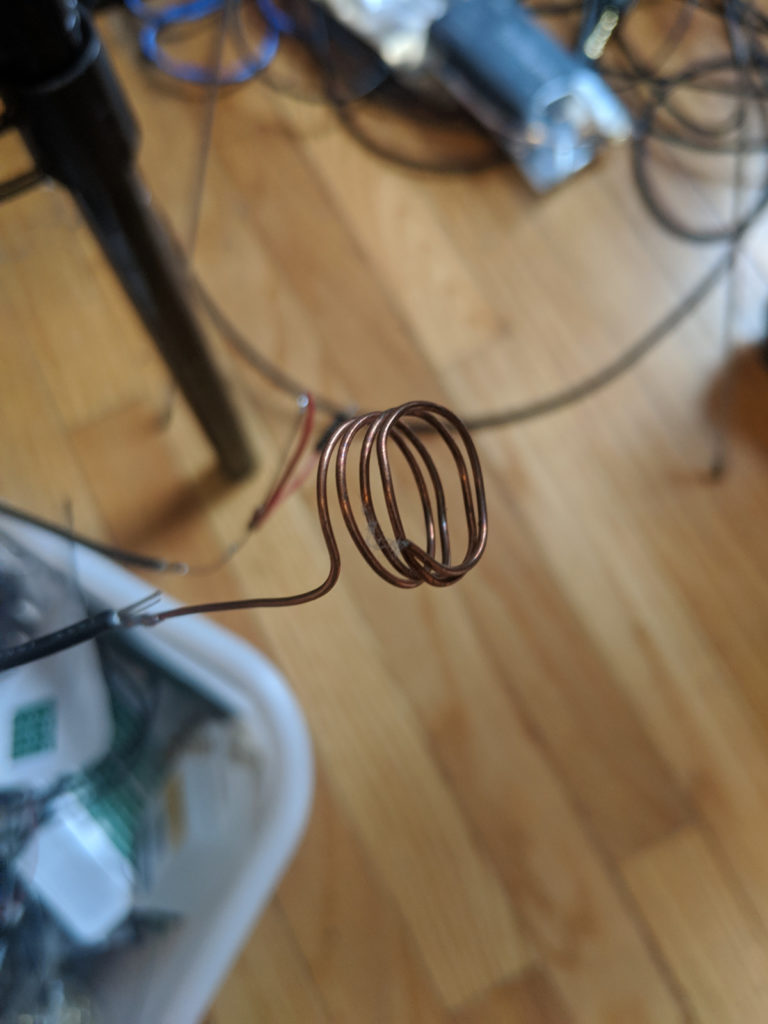
Like the EEG project, actually having a wearable probe is difficult. For GSR, I used the following copper coils:
I also tried mounting the thermistors in sections of pipe which I could use as GSR electrodes. While it looks neat, I think it will require rings which fit better.