SD Card Writes Latency Fixes

The chest strap is just a data logger, it reads from several sensors, logs the recorded data to a (double) buffer, and then sends batches of data off regularly over USB, BLE, or to the SD card. For analysis, it’s important that the data streams are aligned in time to a within decently short (<10ms) amount. It’s not mission critical to get every sensor reading, but the cleaner the timing is the easier later analysis will be.

So how can we check this? Two of the sensor ICs have FIFOs, which is nice because checking to see if data is lost is as simple as checking a FIFO overrun register. It also means that instead of communicating with the IC every sample period, communication can be delayed by a fraction of the FIFO size, so the time latency allowance is much higher. Those sensors each have their own clocks, so their sample rate deviation from nominal is going to be different from the microcontrollers time error, but this can be corrected by occasionally recording the microcontroller time and scaling the sample frequency to correct for the difference in clocks.

The ADC on the chest strap however has no FIFO, which means that the microcontroller has to communicate with it at 480Hz sample rate, giving us a maximum of 2ms where the microcontoller is doing other things (This isn’t exactly true, the data transfer can be set up to respond to the data ready pin with an interrupt, but it gets messier and the SPI mode has to be changed between reading from the ADC and the IMU and I’m not sure if I want to do that in an interrupt context). It also requires an external clock, so if attached to a timer pin on the microcontroller that would prevent drift between the sample rate and the microcontoller clock. The logging system collects timestamps with every N readings to check for missed readings.

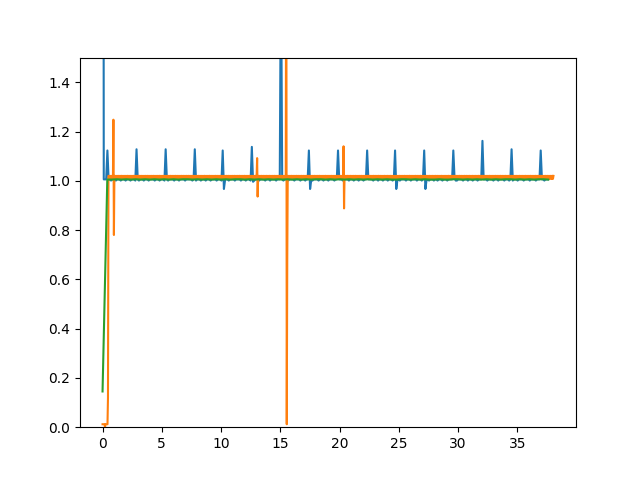
As a sanity check, I plotted the time difference between data reading time normalized to the ‘correct’ time. Below has the ADC (blue), IMU (orange) and PPG (green) data plotted, and we see regular spikes implying we are missing several ADC readings every ~1s. This corresponds to the SD card writes, and turning off SD logging gives an almost perfectly flat graph instead.
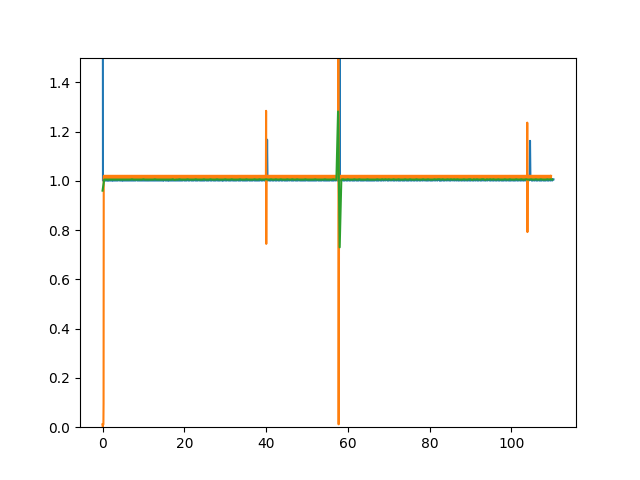
So, how do we make the SD card writes non-blocking? The logging software uses the FATFS file system library, and this was using the f_write function which returns the number of bytes written so it clearly must be blocking. I looked into this briefly, was overwhelmed, and then came back the next day and it was trivial. After opening the file with f_open, f_expand will make the file of X size of contiguous sectors. The f_expand documentation even shows how to write directly to sectors using the disk_write function. For this microcontroller, using the SDMMC interface, disk_write uses the BSP_SD_WriteBlocks function, which has a DMA equivalent. To write the data buffers I just call BSP_SD_WriteBlocks_DMA, after checking that the previous transfer is complete. With this change, the timing plot below is generated. The latency spikes are for closing and opening files, and I’m okay with having some lost data near file open and close.
As a further note, even f_write was not working reliably until I moved to fixed writes of 4kB sizes. I’ve seen stuff claiming SDMMC transfers require writes of 32 byte multiples. It seems . . . broken to me to have the filesystem driver not be able to write files of arbitrary sizes but I haven’t looked into this enough to have a real opinion.
PPG Measurements on the Chest

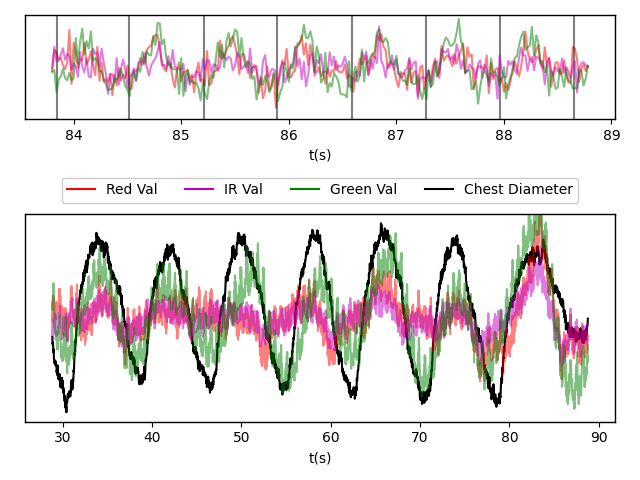
I can track the amount of light reflected in green, red and IR and compare with ECG identified R waves and chest diameter through the strain gauge. The top plot below has vertical lines at times when an R wave is detected, as well as the three reflected light amplitudes. The reflected light amplitudes here are all high pass filtered with a 1Hz critical frequency. The heart beats are clear, but it’s also obvious that identifying heart beats from this signal will be worse than using the ECG signal. The bottom plot has the same data with a filter frequency of 20 seconds, and in black is the chest strap tension filtered with the same filter. It appears from this that breath and heart rate can both be extracted with decent accuracy (at least while the test subject sitting at rest) from PPG.

I was surprised that the signals are clearest with the green LED, however as usual, I shouldn’t be because PPG sensors meant to detect heart rate without SPO2 use only green leds because the scattering distance is shorter with green wavelengths than with red or IR ones.

Progress

Still seeing similar amounts of HRV on day 3, orange is the chest strap tension that measures breathing, black is the R-R interval, blue is the difference between adjacent intervals, magenta is the SDNN HRV metric and red is the RMSSD metric.

I did some other interesting things though.

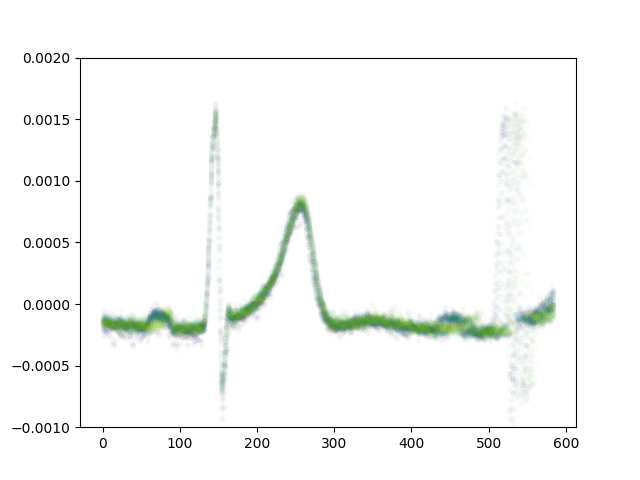
Above is an ensemble of the traces of 30 different beats, aligned to the first R peak. The second R peak is spread because of HRV.

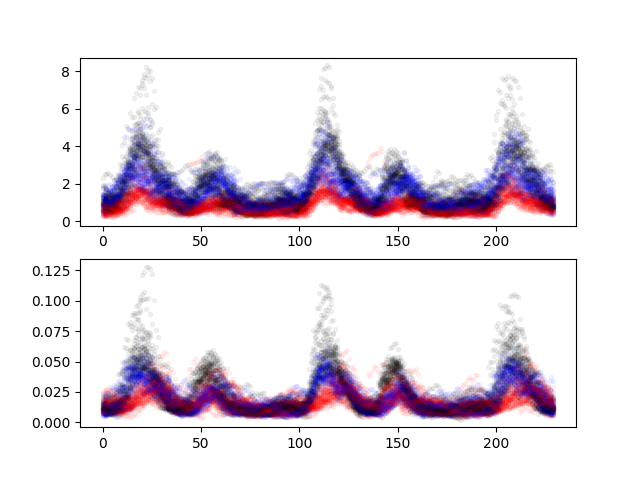
Above is the same style of thing, but instead it graphs X/Y/Z (Black, Blue, Red) low_pass[abs(diff({rotational rate/acceleration}))], using the IMU data aligned to the ECG R wave. There are a pair of accelerations per heart beat.

Resonance Breathing

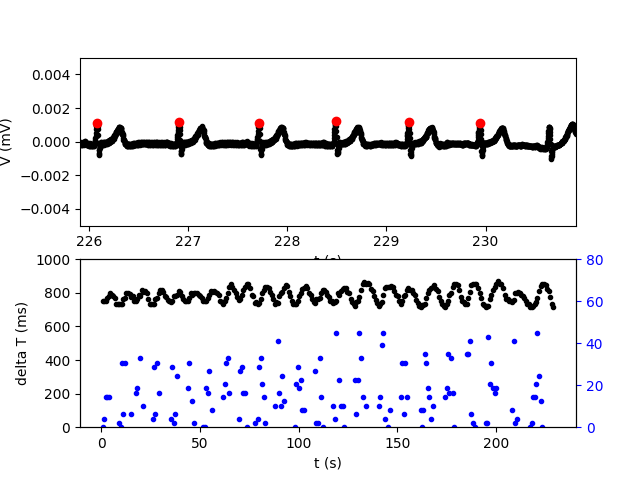
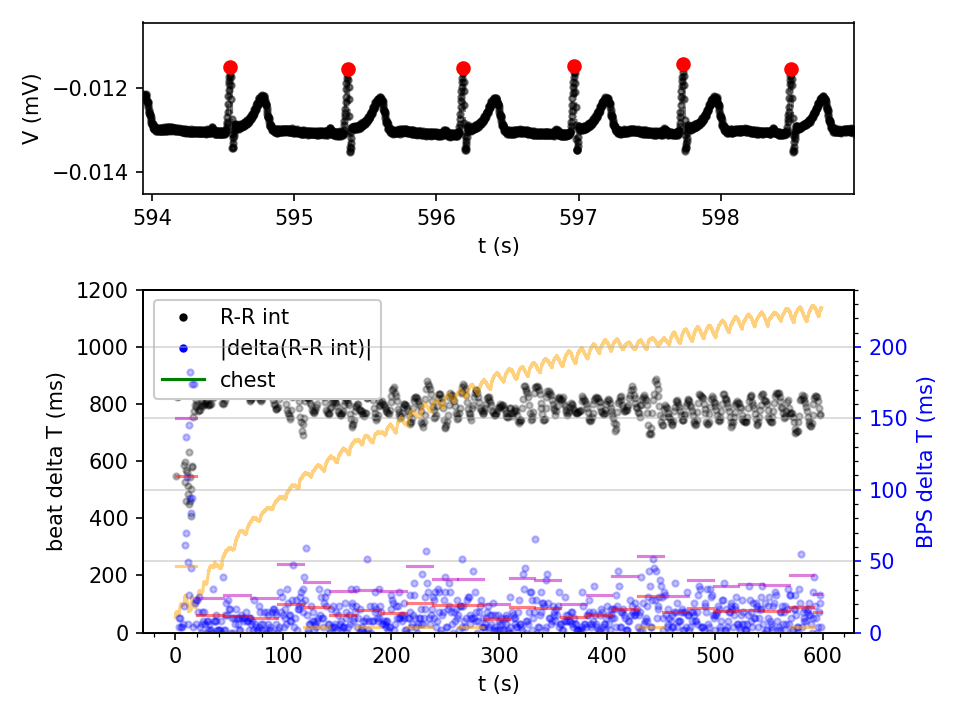
Some HRV resources mention that you can find the optimal breathing rate to temporarily increase HRV, and breathing for several minutes a day at this rate causes lasting increases to HRV. My setup is now good enough to test this. Below I plot the last 5 seconds of ECG data (as a sanity check to make sure the R wave peaks are identified correctly), as well as the time between beats (black), and difference in time between beats (blue) over the entire session. In retrospect, I should have plotted the absolute value of the differences. The respiratory sinus arrhythmia is very evident. During this session I tried 4-4, 5-5 and 6-6 inhale and exhale times. During a different recording sessions I tried much slower breathing and unintuitively noticed less of the arrhythmia (though this agrees with the commonly cited numbers for a good breath rate to increase HRV – I just find it unintuitive).

While ~6 breaths per minute (5s inhale, 5s exhale) is referred to as slow breathing in a lot of the literature, I find this surprisingly fast. When I’ve gone through periods where I trained slow breathing, I could get down to 1.5 breaths per minute, though with training and very relaxed.

On the electrical setup side, this is just streaming the ADC data over BLE. The PCB rests on the skin so that the PPG sensor has contact. I had an issue where the silicone conformal coating started to wear away and there was bad ECG data because the skin would intermittently contact conductive parts of the board. There was also a bit of corrosion from sweat. I cleaned the board and reapplied the same conformal coating, also adding a layer of kapton tape to improve its wear resistance. This is not a good solution, I should have used a different conformal coating, or even painted it with epoxy. There was also an issue where logging to the SD card would start failing, often after several minutes of logging. It seems that preallocating a larger file before any writing fixed that issue.

The next revision of boards are ordered and I look forward to using the improved V2 of this.

First Heart Rate Variability Numbers

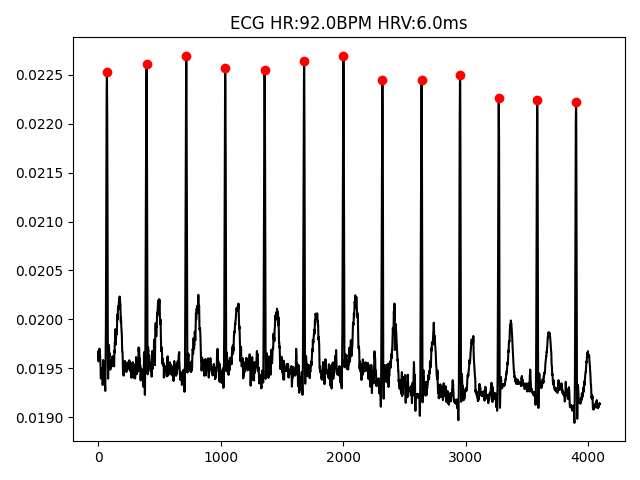
I wrote a tool to extract R-R intervals (identified R peaks shown in red) and measured my heart rate variability a few hours after going to the gym. I used the root mean square of successive differences metric (RMSSD). As you can see from the title text, the values aren’t good (typical HRV might be more like 30-60ms for someone of my age), though this is a particularly bad interval that I selected for its shock value. With the 488Hz sample rate I’m using, the measurement floor is really 2ms, so this is close to as bad as could be measured with this setup.

This is a sign to reduce my caffeine and nicotine intake. The ‘resting’ heart rate of 90 is also terrible.

Biomonitoring Chest Strap

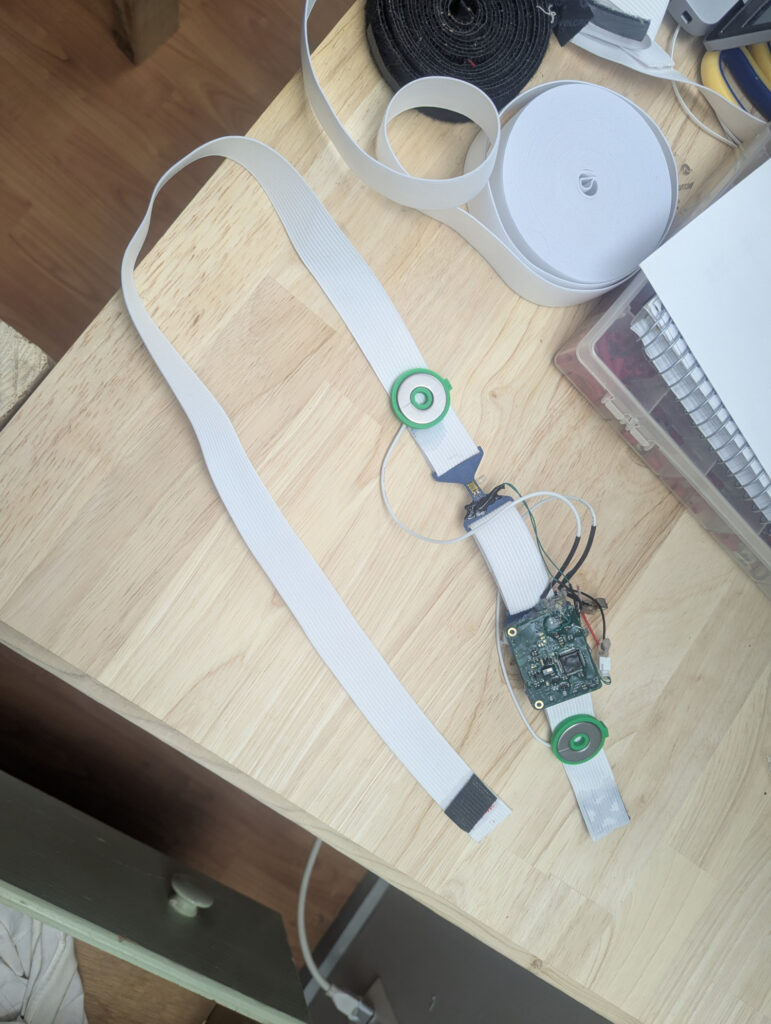
It seems like monitoring heart rate variability is all the rage now-a-days, and I have some free time to work on projects, so I’ve been working on a chest strap that measures EKG, core and ambient temperature, strap tension (for breath tracking), and includes an accelerometer and a PPG/SpO2 sensor. It logs data to an SD card, and can stream sensor data over BLE.

Please forgive the goofy looking washers as electrodes. The sheen is a silicone conformal coating, as the PPG sensor should have skin contact, and at this stage it doesn’t make sense to invest the engineering time for some other form of casing.

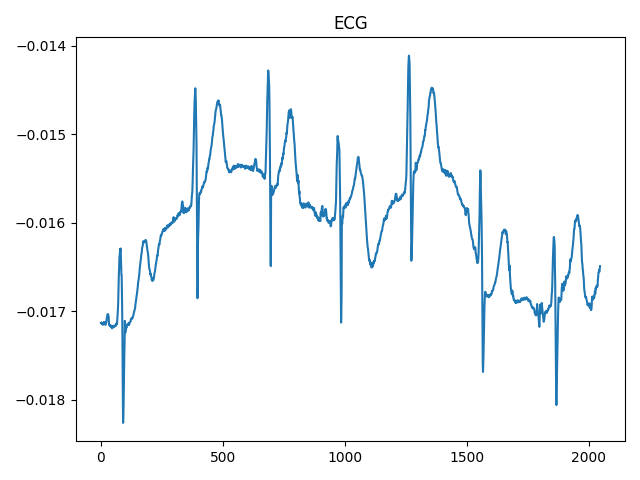
Here’s a dump of some unpolished graphs to show typical performance.

This ECG signal is without software filtering, and really without hardware filtering either (the ADC is a sigma delta ADC, which provides effective decimation at lower sample rates, and there is stuff in the signal chain which does attenuate noise). The board wasn’t laid out as to take a differential measurement – I held one electrode at a low impedance reference voltage and measured the difference between that and the other electrode and was seeing much more line noise. I ended up lifting up some pins on the buffering op amp and ADC and wiring above the board to feed both electrodes into voltage buffers, while also connecting them both to the reference voltage through a very large impedance. I learned my lesson there. There’s also a some signal drift, which is to be expected from the electrochemistry that happens when using stainless steel electrodes.

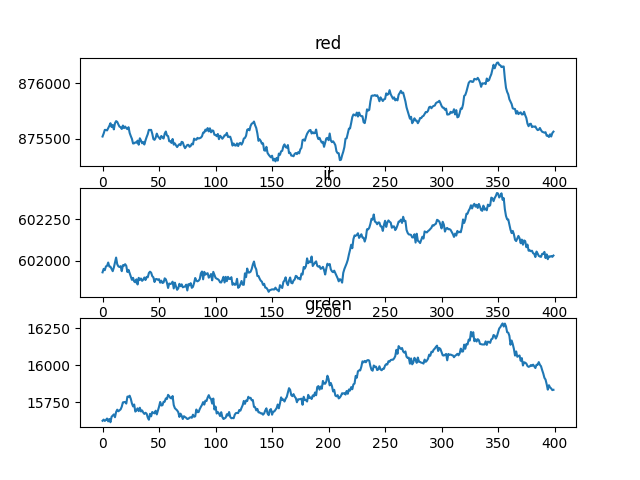
PPG counts from the MAX30101 look pretty fine despite being on the chest – I found a paper claiming that special setups were needed to measure heart rate from PPG on the chest – but this seems to disprove that. If I hold my breath I see large changes to all the values, which squares with my experience from PPG measurements on the fingers (this is supposedly due to changes in internal pressure dilating or contracting capillaries). I find the idea appealing of measuring periphereal PPG in a time synchronized way to measure pulse wave velocity, but that requires another device and I haven’t decided a good way to keep them synchronized enough to measure very small changes.

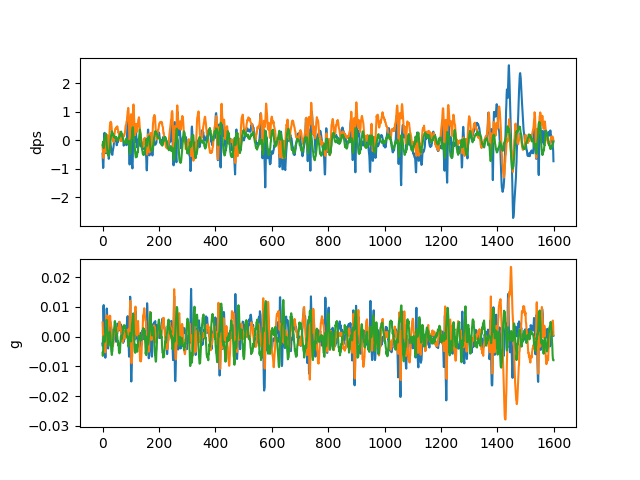
And you can probably guess that the regular acceleration spikes on this graph are also heart beats – but it requires sitting very still to get readings where it’s this clear. It’s possible that with filtering it or a different mechanical coupling scheme it would also be clear be while walking around.

Pulling on the strain gauge by hand shows a clear signal, but breaths are not very obvious, the signals are very small, and, for some reason, there’s noticable cross talk from the ECG signal into the temperature and strap tension channels. It’s weird to talk about ECG interfering with other measurements but here we are. It also hasn’t been long enough to rule out a software error somewhere in the chain. It’s possible that the elastic band needs to be sheathed in a low friction fabric to properly pick up tension.

So what is all this?

There are a lot of poor means to estimate one health quantity from the others. Breathing phase affects heart rate and there are algorithms to estimate breath rate from ECG measured heartbeats. PPG gives us a direct measure of capillary dilation, which gives us a fine measure of internal pressure, which is also affected by breath. The strain gauge should directly measure breath rate, and with one breath volume can also be estimated (but the estimates are much bettwer with a pair of straps). The IMU directly measures how much the chest is moving, but there are a lot of other causes of chest movement than just heart rate. This sort of many-sensor strap lets us gather all this data in parallel and a) get the best estimates of all the interesting qualities and b) allows us to work on ways to improve estimates and fill in the gaps if we only have a subset of these sensors (like a normal chest strap heart rate monitor that only has ECG). Each sensor modality is also only a few dollars, nothing about this has been price-prohibitive, only engineering time limited.

So where am I going from here?

I’m going to be wearing this and doing further data analysis and sofware engineering while working on the next version.