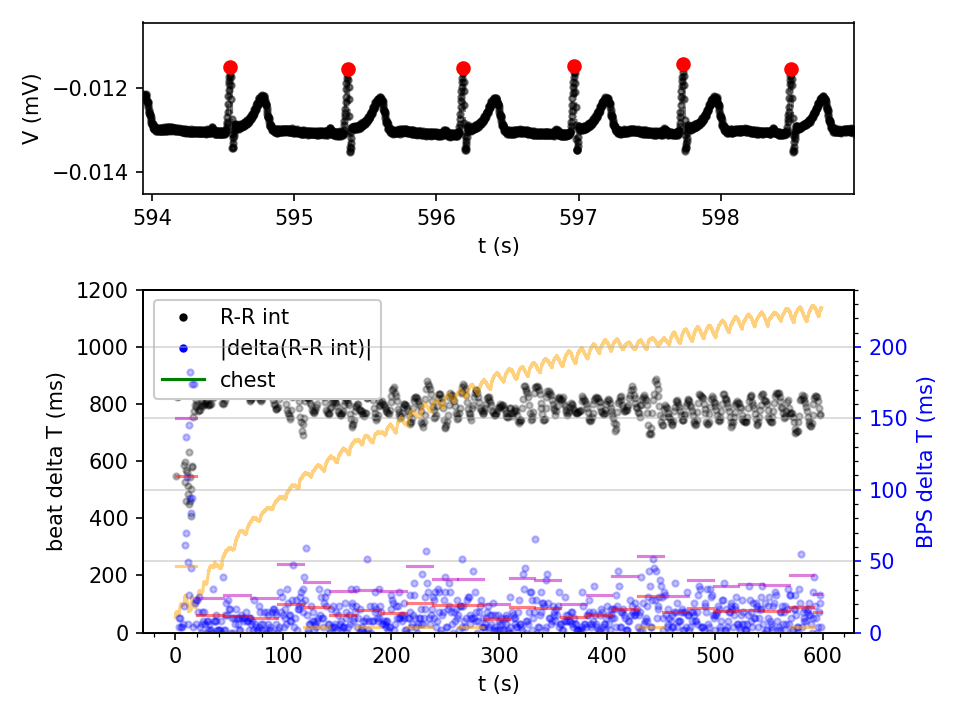
Still seeing similar amounts of HRV on day 3, orange is the chest strap tension that measures breathing, black is the R-R interval, blue is the difference between adjacent intervals, magenta is the SDNN HRV metric and red is the RMSSD metric.
I did some other interesting things though.
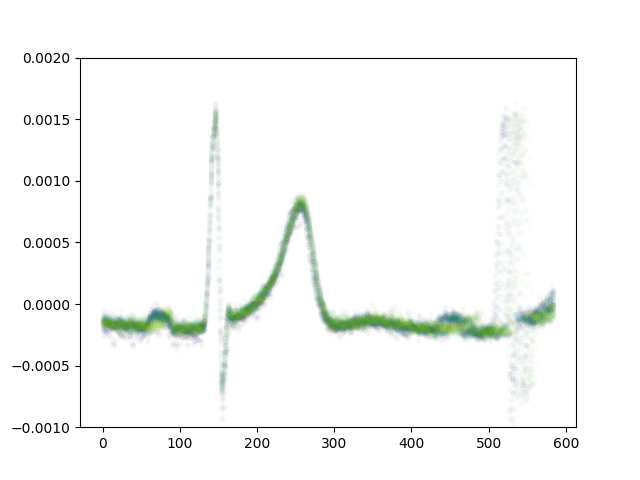
Above is an ensemble of the traces of 30 different beats, aligned to the first R peak. The second R peak is spread because of HRV.
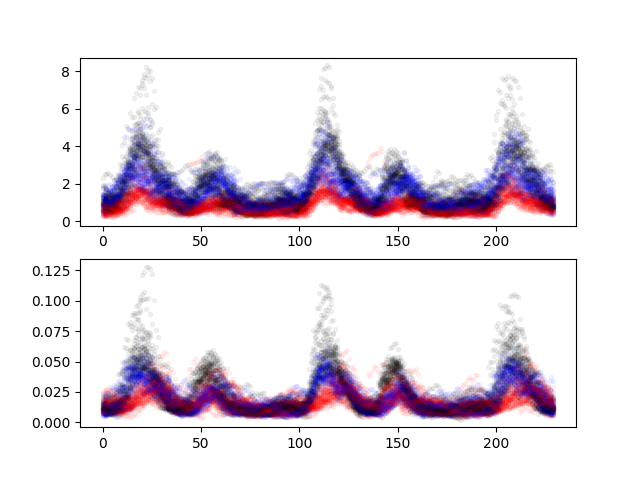
Above is the same style of thing, but instead it graphs X/Y/Z (Black, Blue, Red) low_pass[abs(diff({rotational rate/acceleration}))], using the IMU data aligned to the ECG R wave. There are a pair of accelerations per heart beat.
